GIDEON blog

Free Demo ► Latest Updates ► Video Tutorials ►
Subscribe , j x

HTLV Infection in Australia

The following background information on HTLV infection in Australia is abstracted from Gideon and the Gideon e-book series. [1,2]

The first report of adult T-cell leukemia / lymphoma related to HTLV-1 infection in an Australian Aborigine was published in 1991.  Three such cases had been reported in non-Aboriginal Australians as of 1993. The first report of tropical spastic paraparesis related to HTLV-I infection in an Australian Aborigine was published in 1993; and the first report of HTLV-II infection in Australia was published in 1994.

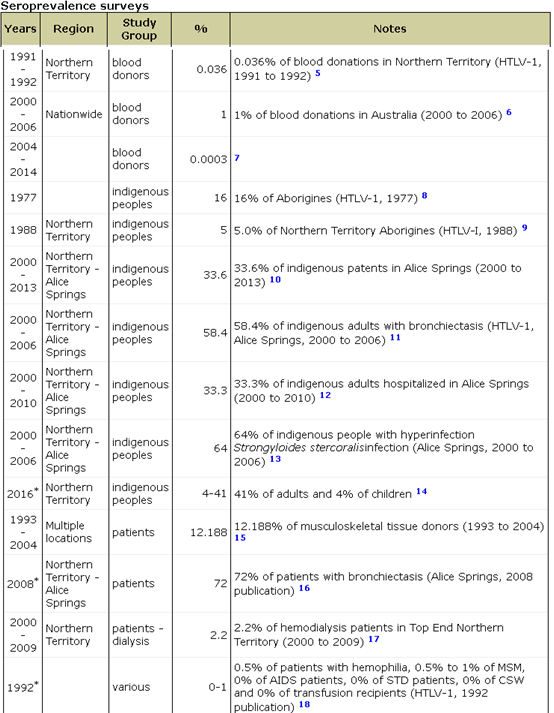
The risk of a transfused patient developing HTLV-I infection from un-screened blood was estimated at 1 in 370,000, and the risk of developing HTLV-I disease at 1 in 9-to-15 million (1993 to 1995).  The following screenshot summarizes published sero-prevalence surveys of HTLV infection in Australia. (primary references available from the authors).
References:

  1. Berger S. Human T-Lymphotropic Virus Infections: Global Status, 2018. 72 pages, 1,133 references. Gideon e-books,  https://www.gideononline.com/ebooks/disease/human-t-lymphotropic-virus-infections-global-status/
  2. Berger S. Infectious Diseases of Australia, 2018. 505 pages, 164 graphs, 3,207 references. Gideon e-books,  https://www.gideononline.com/ebooks/country/infectious-diseases-of-australia/

Note featured on ProMED


Malaria in Trinidad and Tobago

The following background data on malaria in Trinidad and Tobago are abstracted from Gideon and the Gideon e-book series. [1.2]

Trinidad and Tobago was certified “malaria-free” by WHO in December 1965.

84 cases of malaria were reported during 1968 to 1986 (29.8%  due to Plasmodium falciparum)

213 cases were reported during 1968 to 1997 (40% P. falciparum)  These figures included 164 cases imported during 1968 to 1977 – 48.8% from Africa.

118 cases were reported during 1989 to 1998 (33.8% P. falciparum)

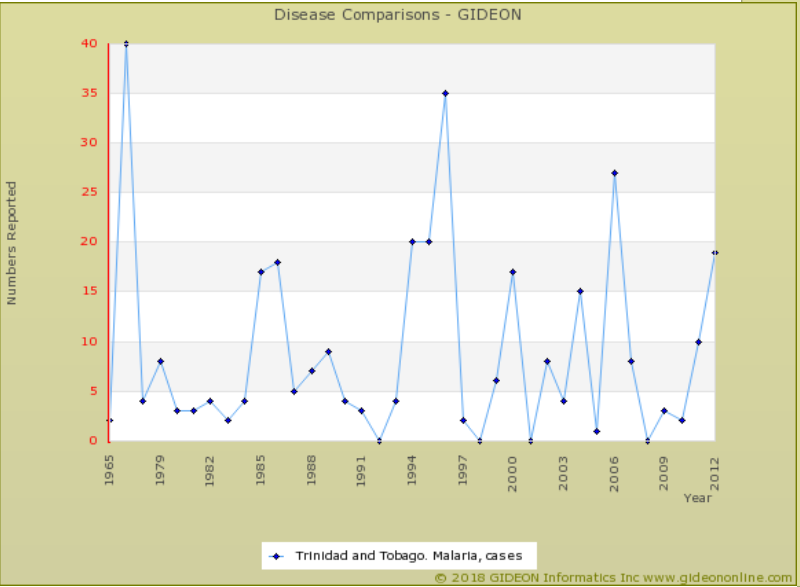
Incidence data for malaria are depicted in the following graph.  Peaks reported during 1966 and 1994 to 1995 reflected local outbreaks (see below).


The local potential vectors are Anopheles aquasalis (coastal swamps), An. bellator (bromeliad malaria),  An. homunculus,  An. albitarsis (rice fields) and An. oswaldoe (small running streams).

Outbreaks of autochthonous malaria:;

1966 – An outbreak (38 cases) of Plasmodium malariae infection was reported on Tobago

1990 to 1991 – An outbreak (10 cases) of Plasmodium vivax infection (vector Anopheles aquisalis) was reported in Icacos village on the southwestern peninsula.  The index patient had arrived from Venezuela

1994 to 1995 – An outbreak (42 cases) of Plasmodium malariae infection (vectors Anopheles bellator and An. homunculus) was reported in a forested area of Navet-Biche, on the northeast coast.  13% of patient contacts were found to be seropositive for malaria.

References:

  1. Berger S. Infectious Diseases of Trinidad and Tobago, 2018. 283 pages, 60 graphs, 266 references. Gideon e-books,  https://www.gideononline.com/ebooks/country/infectious-diseases-of-trinidad-and-tobago/
  2. Berger S. Malaria: Global Status, 2018. 497 pages, 557 graphs, 4,802 references. Gideon ebooks,  https://www.gideononline.com/ebooks/disease/malaria-global-status/


New Video tutorials for Outbreaks, Surveys and Cross Border Events

Dr. Steve Berger has release new videos to review how to use the Outbreaks, Surveys and Cross Border Events Public Health features of GIDEON.

They are included below:

GIDEON in Korean … and any language

Ever since GIDEON launched, one of the top questions from non-native English speakers is when will GIDEON be translated into their local language.
Thanks to the wonders of machine translation built into Google Chrome, the GIDEON web based application can be read in almost any language.
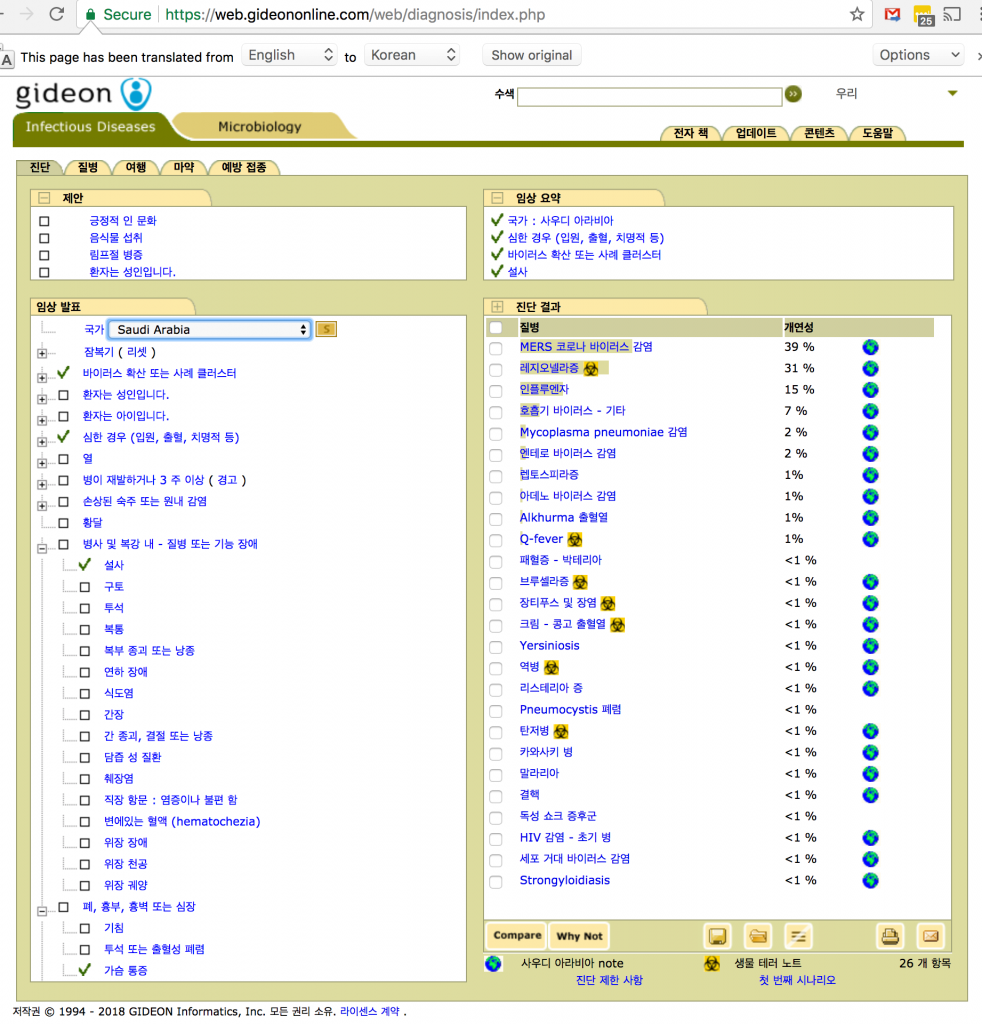
Recently we updated the various tabs to be totally text based rather than graphic based and voila. This is how GIDEON looks in Korean:

Using Chrome right click, Translate and if necessary choose a different language.


Tularemia in Switzerland

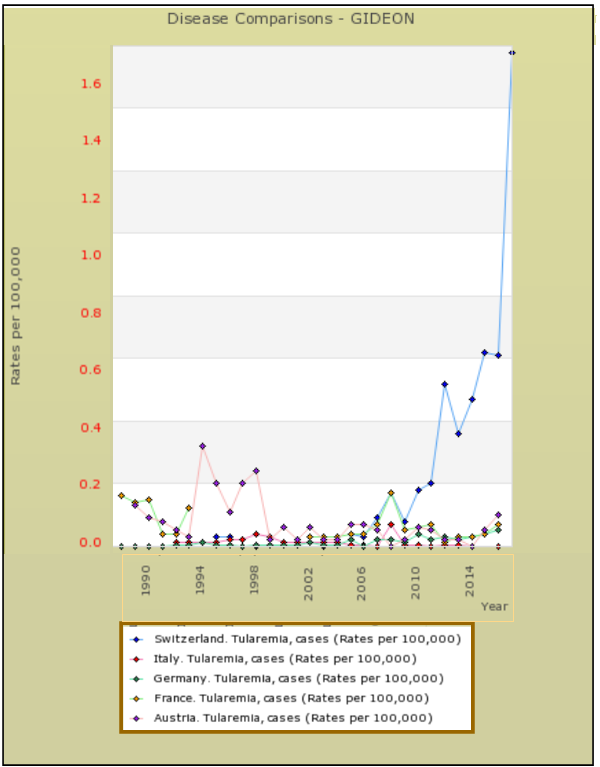
The incidence of tularemia in Switzerland has increased dramatically during the past decade.  As depicted in the following chart, disease rates in this country (per 100,000 population) are currently ten-fold those reported by bordering countries.  [1-3]

References:

  1. Gideon e-Gideon multi-graph tool,  https://www.gideononline.com/cases/multi-graphs/
  2. Berger S. Infectious Diseases of Switzerland, 2018. 393 pages, 144 graphs, 996 references. Gideon e-books  https://www.gideononline.com/ebooks/country/infectious-diseases-of-switzerland/
  3. Berger S. Tularemia: Global Status, 2018. 70 pages, 44 graphs, 660 references. Gideon e-books,  https://www.gideononline.com/ebooks/disease/tularemia-global-status/

Cited on ProMED

Cave Fever in the United States and Israel

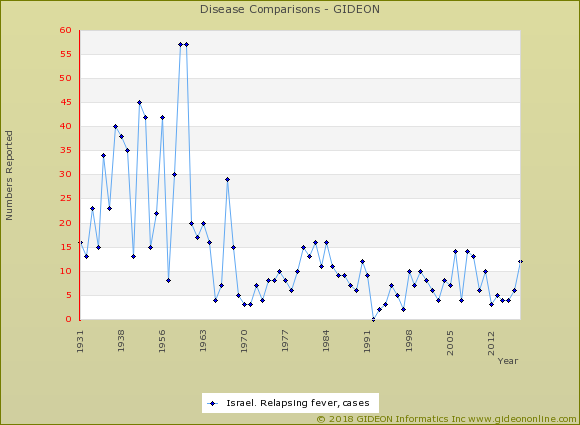
In 2017, several cases of relapsing fever in Texas were reported among cave workers.  The Israeli equivalent of the disease is in fact known as “cave fever” with most cases reported among tourists in caves. [1,2]  Notably, an American tourist acquired “cave fever” in Israel in 1988.  The regional pathogen, Borrelia persica is found in approximately ten percent of caves, and is transmitted by Ornithodorus tholozani, an argassid (“soft”) tick.  The annual incidence has remained fairly stable at 5 to 15 cases for the past five decades.

References:

  1. Berger S. Infectious Diseases of Israel, 2018. 470 pages, 236 graphs, 1,480 references. Gideon e-books,  https://www.gideononline.com/ebooks/country/infectious-diseases-of-israel/
  2. Berger S. Relapsing Fever: Global Status, 2018. 85 pages, 71 graphs, 473 references. Gideon e-books,  https://www.gideononline.com/ebooks/disease/relapsing-fever-global-status/

Post cited on ProMED

Measles Rates vs. Vaccine Coverage

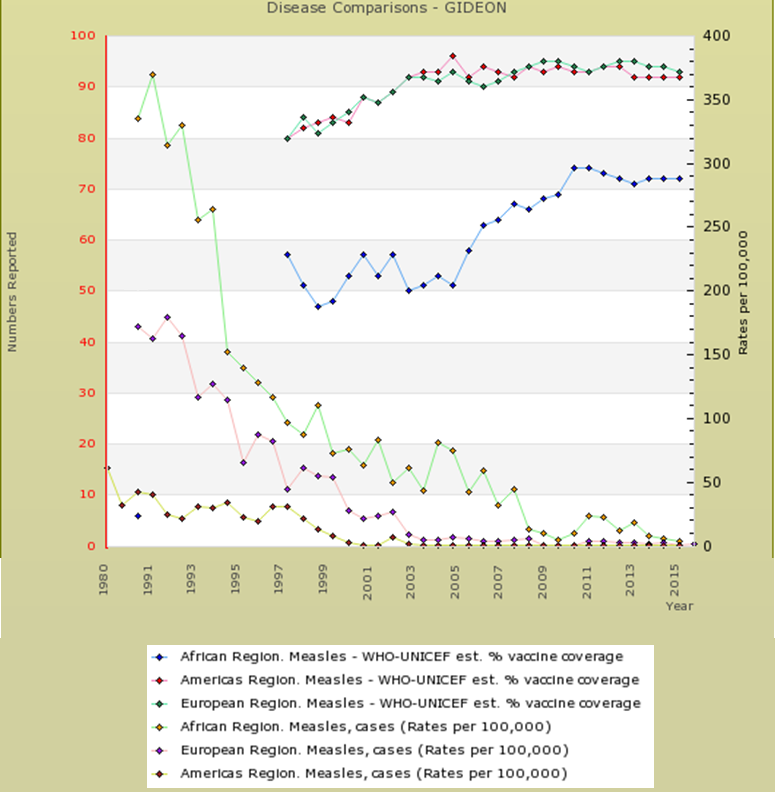
For many years, rates of measles (per 100,000 population) reported by the  WHO European and Americas Regions have been similar. During the same period, both regions have maintained high uptake of measles vaccine. [1,2] In the following graph, I’ve contrasted these figures with those of Africa, which continues to report both high measles rates and inadequate vaccine usage.

References:

  1. Berger S. Measles: Global Status, 2018.  497 pages, 537 graphs, 5,151 references. Gideon e-books,  https://www.gideononline.com/ebooks/disease/measles-global-status/
  2. Berger S. Infectious Diseases of the World, 2018. 1,463 pages, 430 graphs, 39,718 references. Gideon e-books,  https://www.gideononline.com/ebooks/country/infectious-diseases-of-the-world/
  3. Gideon e-Gideon multi-graph tool,  https://www.gideononline.com/cases/multi-graphs/


Listeriosis in the European Union

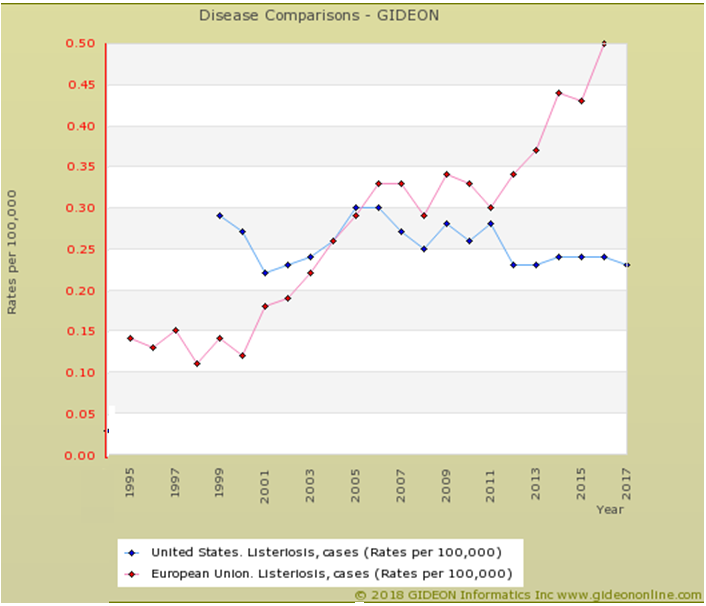
A recent series of outbreaks in Europe reflects an increasing incidence of listeriosis in the region.  In the following graph I’ve contrasted disease rates per 100,000 in the European Union with those of the United States [1,2] :


References:

  1. Berger S. Listeriosis: Global Status, 2018. 128 pages, 108 graphs, 1,203 references. Gideon e-books,  https://www.gideononline.com/ebooks/disease/listeriosis-global-status/
  2. Gideon e-Gideon multi-graph tool,  https://www.gideononline.com/cases/multi-graphs/

Note featured on ProMED

Norovirus Infection in South Korea

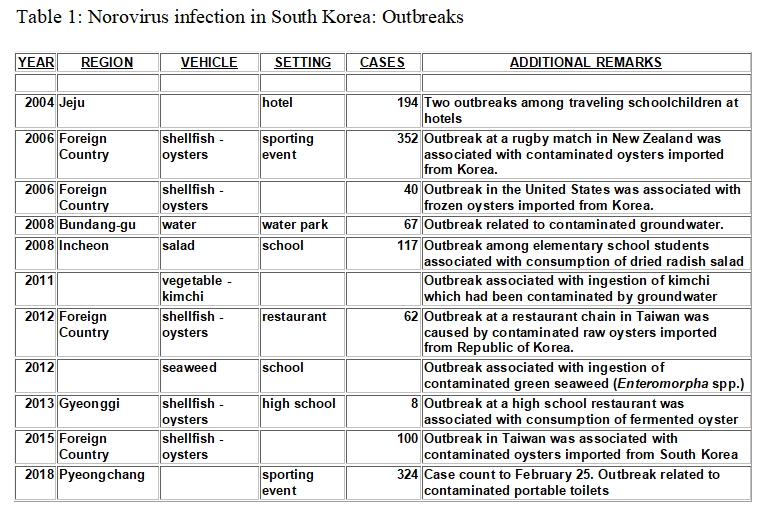
The following background information on Norovirus infection in South Korea was abstracted from Gideon and the Gideon e-book series. [1-3]  A computer-generated parsing program of PubMeD and ProMED identifies 22,521 published Infectious Diseases outbreaks.  735 of these outbreaks specify Norovirus as the disease agent.  South Korea accounts for 0.67% of all outbreaks, and for 1.5% of Norovirus outbreaks.  Details of the individual events are summarized in table 1.

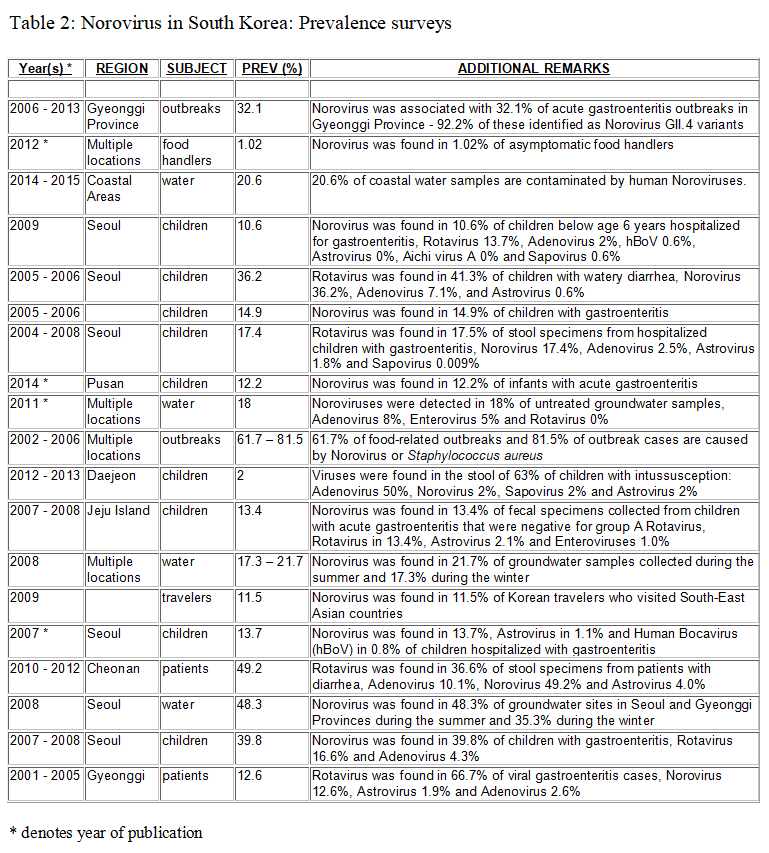
Further analysis of these sources identified 59,774 prevalence / seroprevalence surveys.  745 of these surveys examine the prevalence of viral agents associated with gastroenteritis.  South Korea accounts for 18.6% of all Infectious Disease surveys, and 3.4% of surveys involving viral gastroenteritis. Details of surveys which examine Norovirus prevalence are summarized in table 2.

Primary references are available from the author.

References:

  1. Berger SA. Infectious Diseases of South Korea, 2018. 418 pages, 108 graphs, 2,260 references. Gideon e-books, https://www.gideononline.com/ebooks/country/infectious-diseases-of-south-korea/
  2. Berger SA. Gideon Guide to Outbreaks, 2018. 1,900 pages, 5,246 tables, 50,908 references.  https://www.gideononline.com/ebooks/outbreaks/
  3. Berger SA. Gideon Guide to Surveys, 2018. 4,028 pages, 10,229 tables, 53,802 references.  https://www.gideononline.com/ebooks/surveys/


Read GIDEON ebooks in web app

Since GIDEON first launched ebooks, many app subscribers have wanted to view them. Although the content in the web app is constantly updated and the ebooks are only generated once a year, some users like to view the material in a linear book format.

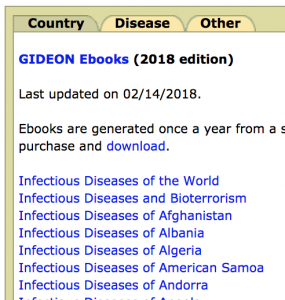
Now, through the Ebooks tab, app users can read the ebooks:

Ebooks are listed by Country, Disease and Other categories:

Ebooks Country list

The full PDF ebook displays in a new window.


Click Buy to purchase the ebook for offline access.

GIDEON Sign In