GIDEON blog

Free Demo ► Latest Updates ► Video Tutorials ►
Subscribe , j x

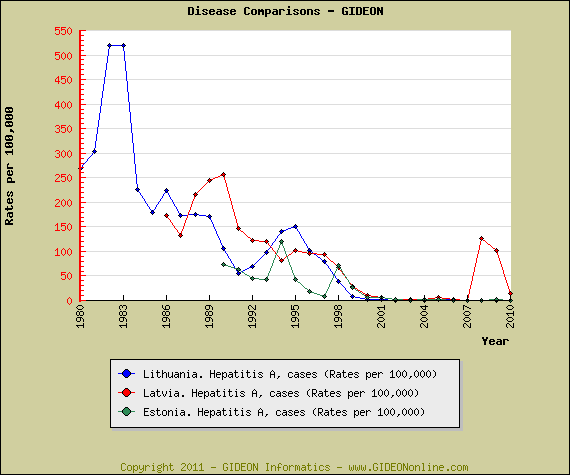
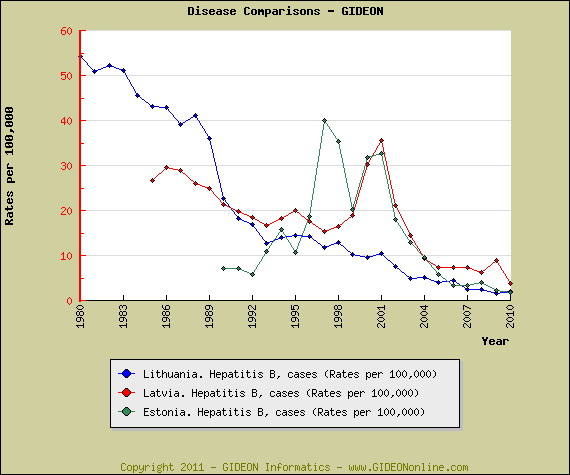
Hepatitis in Estonia

A recent outbreak in Viljandi belies the fact that rates of Hepatitis A and Hepatitis B in the Baltic region have been decreasing since the 1990’s. [1,2] See graphs:

(graph tool tutorial at https://www.gideononline.com/wp-content/uploads/Gideon-Graphs.pps )

The last major outbreak of Hepatitis A in Estonia was reported in 1998 (989 cases).

References:
1. Berger SA. Infectious Diseases of Estonia, 2011. 357 pp, 97 graphs, 887 references. Gideon e-books, https://www.gideononline.com/ebooks/country/infectious-diseases-of-estonia/
2. Berger SA. Hepatitis A: Global Status, 2011. 163 pp, 180 graphs, 1073 references. Gideon e-books, https://www.gideononline.com/ebooks/disease/hepatitis-a-global-status/

Note featured in ProMED: Note reproduced in ProMED

Leptospirosis in Sri Lanka

The following background data on leptospirosis in Sri Lanka have been abstracted from the Gideon web application (Gideon www.GideonOnline.com) and e-book series.l [1,2]

Time and Place:
Leptospirosis was first reported in Sri Lanka in 1953.
– Most cases are reported in Moneragala, Ampara, Matara, Balle and the Northwestern province.
– Highest risk is identified among paddy farmers and sugar cane plantation workers.

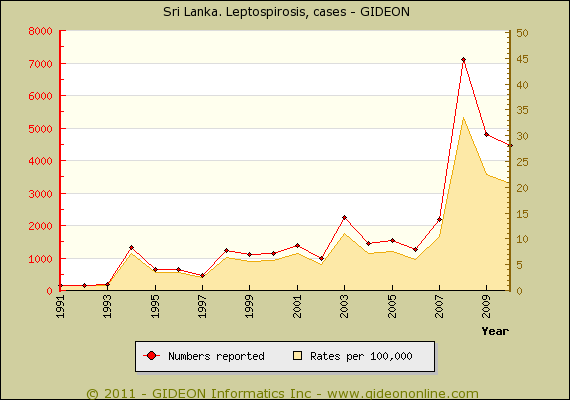
Reported rates have increased dramatically since 2006 – see graph:

(graph creation tool demo at https://www.gideononline.com/wp-content/uploads/Gideon-Graphs.pps)

Prevalence surveys:
13.5% of patients with febrile illness (Galle, 2007)

Seroprevalence surveys:
24.3% of patients with acute febrile illness (Kandy, 2010 publication)
27.1% of patients with febrile illness (Galle, 2007)
20.3% of cattle and 17.5% of rodents (Kandy, 2011 publication)

References:
1. Berger SA. Infectious Diseases of Sri Lanka, 2011. 364 pp, 71 graphs, 1063 references. Gideon e-books, https://www.gideononline.com/ebooks/country/infectious-diseases-of-sri-lanka/2. Berger SA. Leptospirosis: Global Status, 2011. 148 pp, 165 graphs, 834 references. Gideon e-books, https://www.gideononline.com/ebooks/disease/leptospirosis-global-status/
See discussion at ProMED

Cysticercosis in Mexico

Mexico is one of only eight countries which mandate reporting of cysticercosis on a national level. The following background data are abstracted from the Gideon e-book series. [1,2]

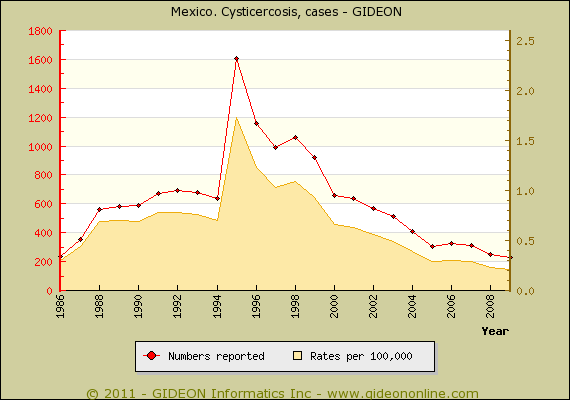
Cysticercosis in Mexico: Incidence and rates per 100,000, see graph:

Prevalence surveys:
Neurocysticercosis is found in 0.4 to 3.5% of autopsies (1980’s) and accounts for 25% of cerebral mass lesions.
Cerebral cysts are identified in 50% of late-onset epileptics (1990)
Six percent of cerebral CT scans are positive for this disease (Yucatan, 1989 to 1994).
0.49% of the Indian rural population of Chiapas are seropositive (1976 publication)
1.5% of persons in the Yucatan are infested by Taenia solium, and 3.7% are seropositive toward the parasite (1996 to 1997).
1.2% of persons in rural Guererro are infested and 3.26% are seropositive (1998)
0.5% of military personnel in Mexico City are infested and 12.2% are seropositive (1999 publication)
43.8% of the population of Cuentpec, Morelos are seropositive, and 9% have neurocysticercosis (2006 publication)
12.2% of military personnel in Mexico City are infested by Taenia solium (1999 publication)

Additional notes:
261 fatal cases were reported in 1990; 293 in 1996.
124 fatal cases were reported in California during 1989 to 2000 – of which 72.6% were Mexican immigrants.
Ten percent of Mexican pork is contaminated by Taenia solium – 23% in the Yucatan (1996 to 1997).

References:
1. Berger SA. Infectious Diseases of Mexico, 2011. 446 pp, 128 graphs, 1655 references. Gideon e-book series, https://www.gideononline.com/ebooks/country/infectious-diseases-of-mexico/
2. Berger SA. Cysticercosis: Global Status, 2011. 25 pp, 8 graphs, 261 references. Gideon e-book series, https://www.gideononline.com/ebooks/disease/cysticercosis-global-status/

Hepatitis A in Bulgaria

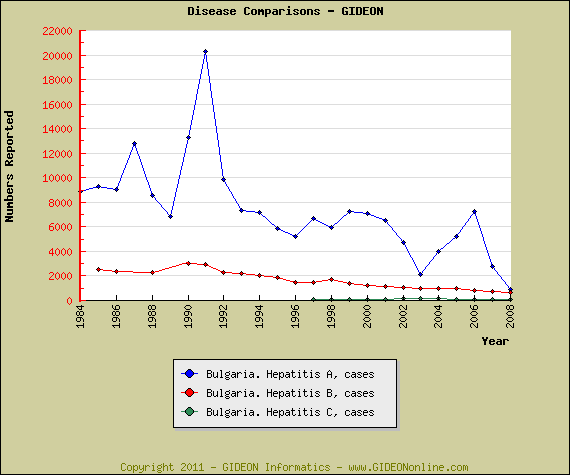
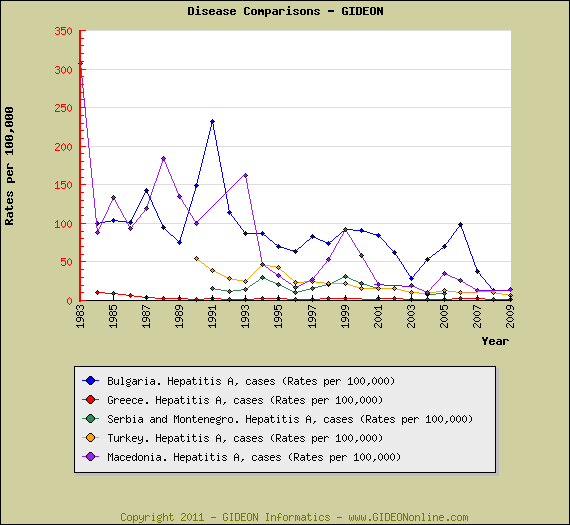
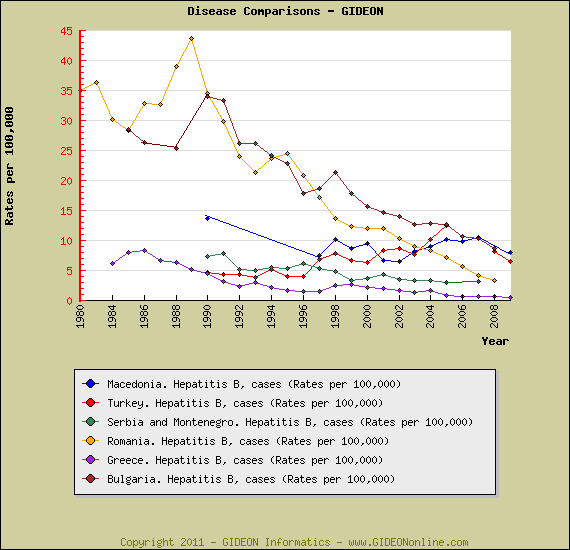
The incidence of viral hepatitis in Bulgaria has actually decreased in recent years [1-3] See graph:

Nevertheless, disease rates in Bulgaria remain slightly higher than those in neighboring countries.

Graphs are generated using an interactive online system – see GIDEON Graphs

References:
1. Berger SA. Infectious Diseases of Bulgaria, 2011. 68 pp, 101 graphs, 967 references. Gideon e-books, https://www.gideononline.com/ebooks/country/infectious-diseases-of-bulgaria/
2. Berger SA. Hepatitis A: Global Status, 2011. 163 pp, 180 graphs, 1073 references. Gideon e-books, https://www.gideononline.com/ebooks/disease/hepatitis-a-global-status/
3. Berger SA. Hepatitis B: Global Status, 2011. 327 pp, 405 graphs, 1517 references. Gideon e-books, https://www.gideononline.com/ebooks/disease/hepatitis-b-global-status/

Note reproduced in ProMED

GIDEON Graphs

The ability to graph data is an indispensable tool in Epidemiology. As of 2011, GIDEON follows reports concerning incidence, mortality and other numerical input for 347 individual diseases in 231 countries. The relevant spread sheets contain over 30,000 individual data sets, containing 550,000 individual data points. All data sets are updated on a continual basis. Users of GIDEON can view and compare any graph or group of graphs using a friendly interactive menu. An overview of this system is available in powerpoint format at the following link: GIDEON Graphs

Relapsing Fever in the United States

The following background data are abstracted from Gideon www.GideonOnline.com and from references 1-2.

Time and Place:
Tick-borne relapsing fever was first described in the United States in 1915 (Colorado).
– Peak incidence is reported during the summer, with 47% of cases from July to August.
– The disease is most common in Arizona, California, Colorado and Oregon.
– Sporadic cases are reported from Idaho, Kansas, Montana, Nebraska, New Mexico, Oklahoma, Texas, Utah, Washington and Wyoming.
– Most cases occur in the Cascade, Rocky Mountain, San Bernadino and Sierra Nevada ranges.
– 40% of cases involve tourists to endemic areas (1977 to 2000).
– Tick-borne relapsing fever is reportable in Arizona, California, Colorado, Idaho, New Mexico, Nevada, Texas, Utah and Washington.
– 450 cases (300 confirmed and 150 probable) were reported by 11 western states during 1977 to January 2000. Only one fatal case was reported during this period – a neonate born to an infected mother.
– 285 cases were reported by California, Colorado, Idaho, Texas and Washington during 1985 to 1996.

The first case of louse-borne infection in the United States during the twentieth century was reported in 1976 – imported from Ethiopia.

Additional geographic notes:
– Washington and Oregon reported 30 cases during 1965 to 1978.
– Colorado reported 2 cases during 1945 to 1976; 3 in 1977.
– Washington reported 24 cases during 1991 to 1994.
– Oregon reported 73 cases during 1964 to 1989; Washington 27; Arizona 74; Texas 25; Idaho 13; New Mexico 15; Oklahoma 2.
– California reported 251 cases during 1921 (state’s first case) to 1941; 173 during 1964 to 1989; 95 during 1978 to 1998 (including 3 to 18 cases yearly during 1985 to 2002). five cases were reported in the Lake Tahoe region in 2005, 3 during the summer of 2006.
– Texas reported 13 cases during 1990 to the first half of 1994.

An American tourist acquired relapsing fever in Israel (1988 publication).

Infecting species:
– Borrelia hermsii (vector Ornithodoros hermsi) and B. coriaceae in the western region
– B. turicatae (vector O. turicatae) in the southwest. There is also evidence for the existence of Borrelia turicatae in Florida. – B. parkeri (vector O. parkeri) in the west
– B. mazzottii (vector O. talaje) in the south.
– B. miyamotoi has been identified in ixodid ticks (Ixodes pacificus) in California (2006 publication)
– B. coriaceae has been identified in Ornithodoros coriaceus, a common parasite of livestock in the western United States.

Prevalence surveys:
1.9% of I. scapularis adults and 0.8% of nymphs in the northeastern United States (Borrelia miyamotoi, 2009 publication)

Notes regarding transmission:
– Ornithodoros hermsi is nocturnal and feeds within 20 to 90 minutes – thus, patients rarely recall the tick bite.
– B. hermsii is maintained in small sylvatic rodents, notably chipmunks (Tamias spp.) and pine squirrels (Tamiascuirus spp.) above 1,000 meters’ elevation.
– Antibodies to Borrelia hermsii are present in 5.4% of big brown bats (Eptesicus fuscus). (Georgia, 2007 publication)
– Borrelia turicatae has been detected in dogs in Texas. (2007 publication)

Notable outbreaks:
All of the following outbreaks were associated with tick (Ornithodoros spp.) infestations of rodent nests in cabins.
1968 – An outbreak was reported in Spokane County, Washington.
1973 – Outbreaks (62 clinical cases, 16 confirmed) were reported in Grand Canyon National Park, Arizona.
1989 – An outbreak (6 cases) was reported in San Bernardino County, California.
1990 to 1991 – Outbreaks (24 cases, 14 confirmed) were reported in Grand Canyon National Park, Arizona. No outbreaks were reported in this area during 1992 to 1999.
1995 – An outbreak (23 family members) was reported among campers in Colorado.
2002 – An outbreak (5 cases) of Borrelia hermsii infection was associated with a cabin in western Montana. Infected ticks (Ornithodoros hermsi) were identified at the time.
2002 – An outbreak was associated with a family gathering in New Mexico.

References:
1. Berger SA. Relapsing fever: Global Status,, 2011. 63 pp, 68 graphs, 174 references. Gideon e-books, https://www.gideononline.com/ebooks/disease/relapsing-fever-global-status/
2. Berger SA. Infectious Diseases of the United States, 2011. 1030 pp, 464 graphs, 8237 references. Gideon e-books, https://www.gideononline.com/ebooks/country/infectious-diseases-of-the-united-states/
Mumps in the Czech Republic

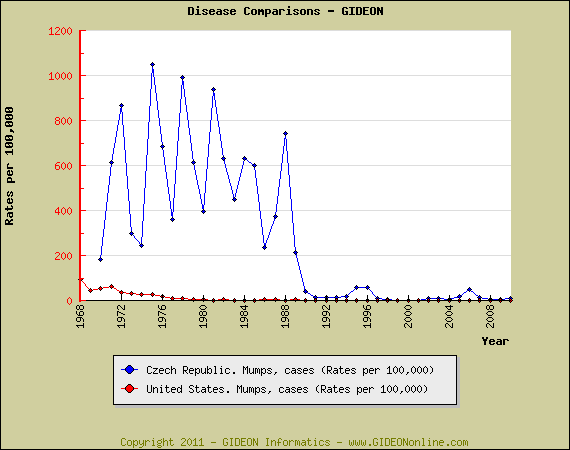
Notwithstanding an ongoing outbreak in northern Bohemia, the Czech Republic has managed to reduce mumps to levels comparable to those of the United States. In the following graph, I have contrasted rates per 100,000 population for these two countries:

Graph generation system outlined in [1])

Note that a precipitous decline in mumps in the Czech Republic followed the introuction of widespread MMR vaccination in 1987. [2,3]

1. Gideon Graphs module tutorial Gideon Graphs
2. Berger SA. Infectious Diseases of the Czech Republic, 2011. 424 pp, 139 graphs, 1192 references. Gideon e-books, https://www.gideononline.com/ebooks/country/infectious-diseases-of-the-czech-republic/
3. Berger SA. Mumps: Global Status, 2011. 157 pp, 187 graphs, 390 references. Gideon e-books, https://www.gideononline.com/ebooks/disease/mumps-global-status/

Reproduced by ProMED

Hepatitis C in Scotland

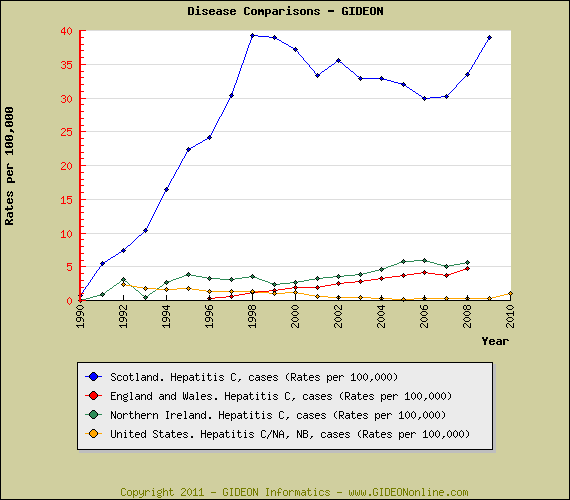
A recent post in ProMED highlights the fact that rates of Hepatitis C in Scotland are more than seven-fold higher than those of neighboring countries, and twenty-fold those reported in the United States. [1,2] See graph

References:
1. Berger SA. Infectious Diseases of Scotland, 2011. 403 pp, 140 graphs, 1233 references. Gideon e-books, https://www.gideononline.com/ebooks/country/infectious-diseases-of-scotland/
2. Berger SA. Hepatitis C: Global Status, 2011. 164 pp, 160 graphs, 1500 references. Gideon e-books, https://www.gideononline.com/ebooks/disease/hepatitis-c-global-status/

Update: Posted in ProMED

E. coli Outbreaks and Recreational Water

A search of the Gideon database reveals 973 country-specific notes (244,226 cases) which detail one or more outbreaks of E. coli gastroenteritis. [1,2]

Recreational water was specified as the vehicle in only 16 (1.6% of total) outbreaks, involving 244 patients (0.10% of total) – in chronological order, as follows:

1991 – U.S.A. 59 cases of E. coli O157:H7 infection (21 cases) and Shigella sonnei infection (38 cases) associated with a lakeside park in Oregon.
1993 – U.K. 6 cases (3 HUS, 1 fatal) associated with paddling pools.
1993 – Netherlands. 4 cases of HU.S.A.due to E. coli O157:H7 associated with a swimming pool.
1995 – U.S.A. E. coli O157:H7 infection associated with a lake in Illinois. {p 8618543}
1996 – U.S.A. 18 cases of E. coli O157:H7 infection in Georgia associated with a swimming pool.
1997 – Finland. 14 cases of E. coli O157:H7 associated with a swimming beach in Alavus. This was Finland’s first outbreak of O157:H7 infection.
1997 (publication year) – U.S.A. 12 cases of Escherichia coli O157:H7 infection associated with a fresh water lake at a county park.
1997 – U.S.A. 8 cases of E. coli O157:H7 infection associated with recreational water at a lake resort in Missouri.
1998 – U.S.A. 31 cases of E. coli O157:H7 infection associated with recreational water – 26 cases at a water park in Georgia and 5 cases at a lake in Minnesota.
1999 – U.K. 14 cases of E. coli O157 infection (one fatal) among visitors to a beach in South Devon
1999 – U.S.A. 37 cases (8 hospitalized, 3 HUS) of E. coli O157:H7 infection associated with a recreational lake in Washington State
1999 – U.S.A. 3 cases of Escherichia coli O157:NM (nonmotile) associated with recreational exposure to lake water.
1999 – U.S.A. 11 cases (3 HUS) of E. coli O121 infection associated with a lake in Connecticut.
2004 – Canada. An outbreak 10 cases (confirmed probable of E. coli O157:H7 infection associated with a children’s spray park in British Columbia.
2005 – U.S.A. 2 hospitalized cases of E. coli O157:H7 infection associated with a lake in Minnesota.
2011 – U.S.A. 15 cases of E. coli O157:H7 infection associated with a water park in Alabama.

(primary references are available on request)

References:
1. Gideon www.GideonOnline.com (internal search function (key words: coli, recreational, swimming, lake, fountain, beach)
2. Berger SA. Escherichia coli Diarrhea: Global Status, 2011. 139 pp, 148 graphs, 1316 references. Gideon e-books. https://www.gideononline.com/ebooks/disease/escherichia-coli-diarrhea-global-status/

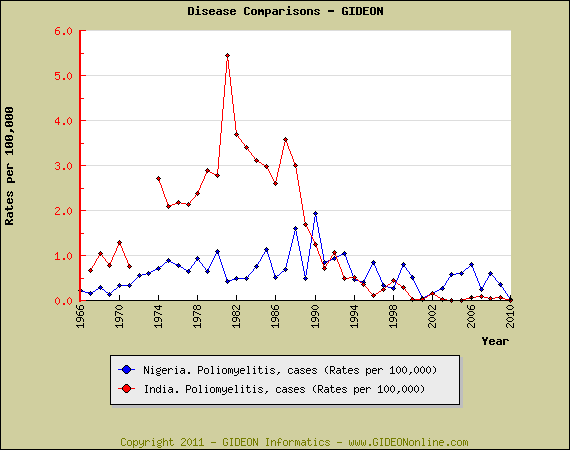
Poliomyelitis: India, Nigeria, Pakistan and the World

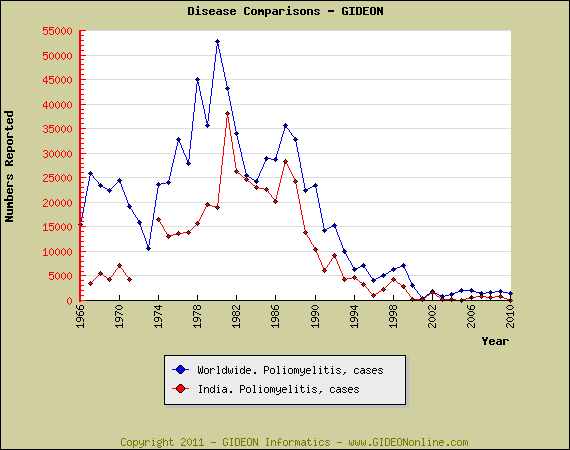
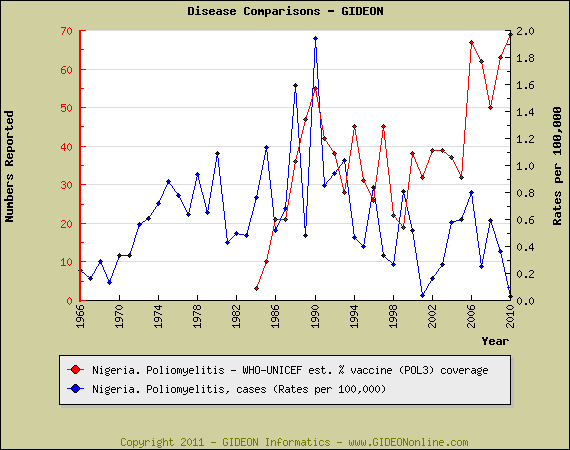
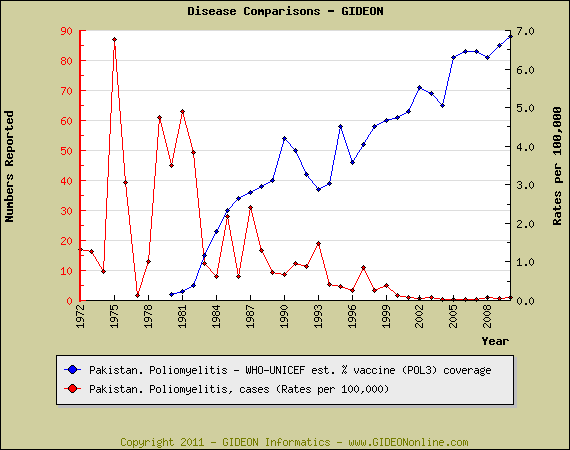
The growing contribution of Nigeria and Pakistan to global poliomyelitis incidence reflects decreasing incidence in India, rather than an absolute increase in Nigeria and Pakistan. [1-4] These trends continue to illustrate the relative success of mass vaccination. *

Health care workers in Nigeria and Pakistan might find the last two graphs useful in convincing citizens who hesitate to vaccinate their children.

* Custom graphs are generated using an interactive module in Gideon https://www.gideononline.com/cases/video/multi-graphs/

References:
1. Berger SA. Infectious Diseases of India, 2011. 480 pp, 65 graphs, 3503 references. Gideon e-books, https://www.gideononline.com/ebooks/country/infectious-diseases-of-india/
2. Berger SA. Infectious Diseases of Nigeria, 2011. 410 pp, 60 graphs, 1684 references. Gideon e-books, https://www.gideononline.com/ebooks/country/infectious-diseases-of-nigeria/
3. Berger SA. Infectious Diseases of Pakistan, 2011. 354 pp, 39 graphs, 1243 references. Gideon e-books, https://www.gideononline.com/ebooks/country/infectious-diseases-of-pakistan/
4. Berger SA. Poliomyelitis: Global Status, 2011. 540 pp, 867 graphs, 994 references. Gideon e-books, https://www.gideononline.com/ebooks/disease/poliomyelitis-global-status/

Featured in ProMED

GIDEON Sign In