GIDEON blog

Free Demo ► Latest Updates ► Video Tutorials ►
Subscribe , j x

GIDEON Demo at Singapore Travel Conference

Dr. Steve Berger has been invited to demonstrate Gideon at the 9th Asia Pacific Travel Health Conference, to be held in Singapore during May 2 through May 5, 2012. His session will take place during Workshop 05 (“Resources in Travel Medicine”), on May 5, between 14:00 to 15:30. All Conference attendees will be offered a free copy of the new 2012 edition of Infectious Diseases of Singapore (395 pages, 111 graphs, 1,492 references). This is one of a series of Gideon e-books which summarize the status of every disease, in every country of the world.

Further information on the conference is available at:
http://www2.kenes.com/apthc/

Leprosy in the Western Pacific Region

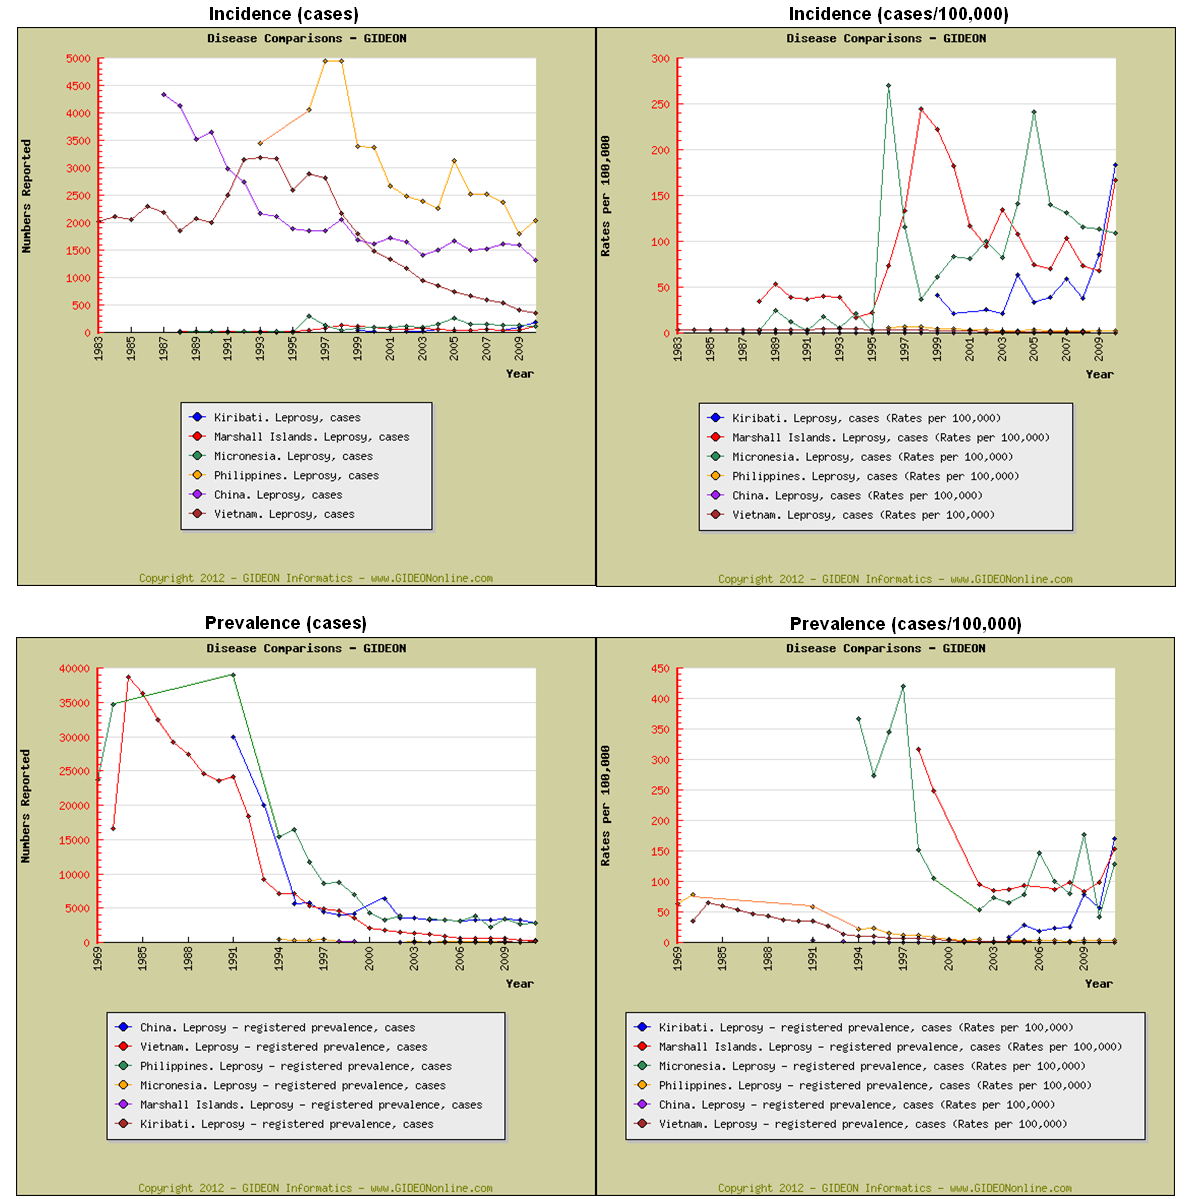
Leprosy data for the Western Pacific Region indicate that disease incidence is highest in the Philippines, Vietnam and China. In the following graph, I have contrasted incidence and prevalence statistics for countries mentioned in the ProMED note, with population-adjusted rates for these same data. [1,2] Note that the numbers of cases per 100,000 population are highest in Micronesia, Kiribati and the Marshall Islands. See graph:

References:
1. Berger SA. Leprosy: Global Status, 2012. 236 pp, 376 graphs, 226 references. Gideon e-books, https://www.gideononline.com/ebooks/disease/leprosy-global-status/
2. Gideon graph tool at https://www.gideononline.com/wp-content/uploads/Gideon-Graphs.pps

Note featured on ProMED

Plague in Uganda

The following background data on Plague in Uganda are abstracted from Gideon www.GideonOnline.com and the Gideon e-book series. [1,2]

The earliest record of plague in Africa was a report by missionaries in Uganda in 1877, and reporting statistics for much of the continent have been documented for more than 100 years.

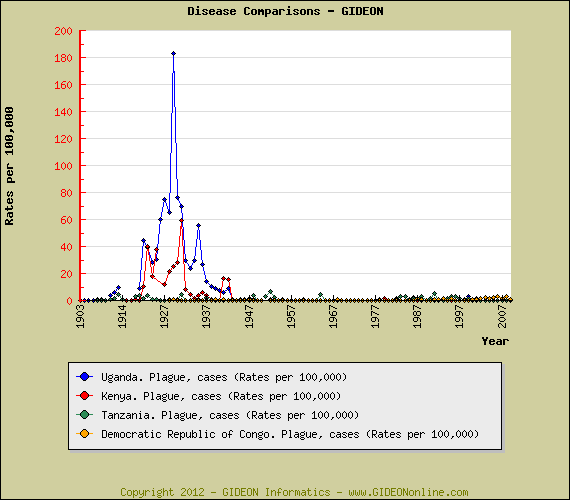
A series of plague epidemics were recorded in East AFrica during the 1920’s and 1930’s – see graph [3]

31,305 plague deaths were reported in Uganda during 1910 to 1919; 17,410 during 1920 to 1929; 11,387 during 1930 to 1939.

Presumed local reservoirs include the Nile rat, Arvicanthus niloticus.
– Presumed local flea vectors include Xenopsylla cheopis and X. brasiliensis.

Notable outbreaks:
1982 – An outbreak (152 cases, 3 fatal) was reported.
1986 – An outbreak (340 cases, 27 fatal) was reported.
1993 – An outbreak (167 cases, 18 fatal) was reported in Western Region (Nebbi District).
1998 – An outbreak was reported in Arua district.
2001 – An outbreak was reported in Nebbi District.
2004 – An outbreak (4 cases, 1 confirmed, 3 fatal) of pneumonic plague was reported in Kango Subcounty.
2006 – An outbreak (127 cases, 11 fatal) was reported in Arua and Nebbi Districts – including 12 cases of pneumonic plague.
2007 – Outbreaks (179 cases, total) were reported in Masindi District (19 cases, 9 fatal), and in Arua (121 cases, 10 fatal) and Nebbi (39 cases, 9 fatal).
2008 – An outbreak (68 deaths) was reported in Arua and Nebbi.

References:
1. Berger SA. Infectious Diseases of Uganda, 2012. 398 pp, 61 graphs, 1,711 references. Gideon e-books, https://www.gideononline.com/ebooks/country/infectious-diseases-of-uganda/
2. Berger SA. Plague: Global Status, 2012. 98 pp, 102 graphs, 524 references. Gideon e-books, https://www.gideononline.com/ebooks/disease/plague-global-status/
3. Gideon graph tool at https://www.gideononline.com/wp-content/uploads/Gideon-Graphs.pps

Note featured on ProMED

Hepatitis A in the Netherlands

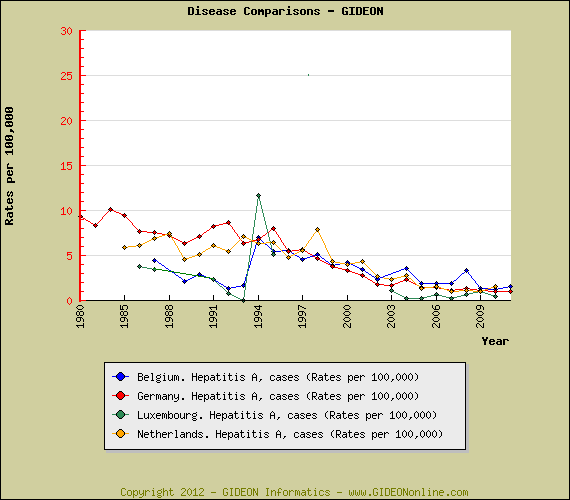
Rates of Hepatitis A in the Netherlands and bordering countries have been decreasing since the 1990’s – see graph:

The following background data are abstracted from the Gideon e-books series. [2,3]

Time and Place:
– Hepatitis A has been a notifiable disease in the Netherlands since 1951.
– Disease rates peak during October, largely due to increased number of cases acquired abroad.
– During 1993 to 2002, 64.4% of all cases were autochthonous, 6.5% imported from Turkey and 11.5% from Morocco.
– The disease incidence among children of Turkish and Moroccan descent declined from 70.3 per 100 000 in 2000, to 13.5 per 100 000 in 2005
– During 1992 to 2006, 1,697 cases were reported among MSM visiting STD clinics (mean rate 97 per 100,000 population)

Prevalence surveys:
1.1% of dates and 0% of fig samples (viral RNA, 2011 publication)

Seroprevalence surveys:
33.8% of the general population – including (age group 15 to 49 years) 90.9% of Turks, 95.8% of Moroccans, 20.1% of native Dutch and 25% of other Western people (2000 publication)
34% of the general population during 1995 to 1996; 39% during 2006 to 2007
41% of blood donors and 33.8% of the general population (1995 to 1996)
less than 10% below age 35; 25% at 35 years; 85% at 79 years

Notable outbreaks:
1977 – An outbreak (20 cases) in Amsterdam was caused by contaminated meat sold at a butcher shop.
1991 to 1993 – An outbreak (37 cases) was reported among MSM in Amsterdam.
1996 – An outbreak (41 cases) was reported in Heerlen.
1998 – An outbreak in Rotterdam was associated with MSM who frequented ‘gay bars.’
1999 – An outbreak (11 cases or more) in Nijmengen involved two schools and a nursery.
2004 – An outbreak (351 cases) was caused by contaminated orange juice served to tourists at a hotel in Egypt. 271 primary (and 7 secondary) cases were reported among Germans, 18 primary (13 secondary – from a food handler) cases Austrians, 10 Swedes, 9 Danes, 9 Dutch, 6 Belgian, 5 British, 2 Italian and 1 Swiss.
2004 – An outbreak (30 cases) was reported among homeless and drug users in Rotterdam.
2005 to 2006 – An outbreak (30 cases) was reported among elementary school children in Noord-Kennemerland region.
2009 to 2010 – An outbreak (11 cases) was associated with consumption of semi-dried tomatoes.

References:
1. Gideon graph tool at https://www.gideononline.com/wp-content/uploads/Gideon-Graphs.pps
2. Berger SA. Infectious Diseases of the Netherlands, 2012. 502 pp, 144 graphs, 2,091 references. Gideon e-books, https://www.gideononline.com/ebooks/country/infectious-diseases-of-the-netherlands/
3. Berger SA. Hepatitis A: Global Status, 2012. 166 pp, 180 graphs, 1,180 references. Gideon e-books, https://www.gideononline.com/ebooks/disease/hepatitis-a-global-status/

Note featured on ProMED

Syphils vs. AIDS in Canada

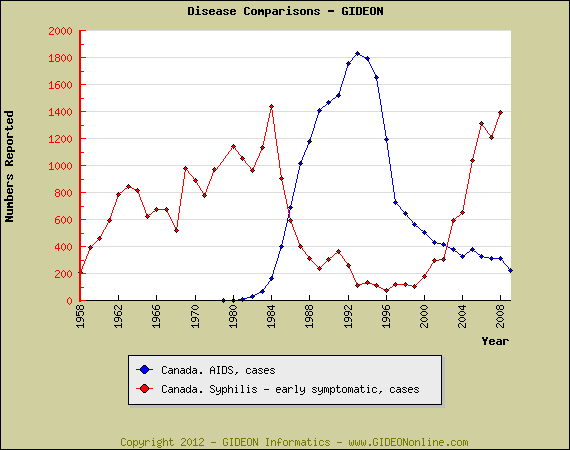
As in several other countries, including the United States, rates of syphilis in Canada decreased and later “rebounded” in parallel with an initial explosion and later decline in AIDS reporting. [1, 2] See graph [3]:

References:
1. Berger SA. Infectious Diseases of Canada, 2012. 496 pp, 107 graphs, 3106 references. Gideon e-books, https://www.gideononline.com/ebooks/country/infectious-diseases-of-canada/
2. Berger SA. Syphilis: Global Status, 2012. 238 pp, 339 graphs, 970 references. Gideon e-books, https://www.gideononline.com/ebooks/disease/syphilis-global-status/
3. Gideon graph tool at https://www.gideononline.com/wp-content/uploads/Gideon-Graphs.pps

Note featured on ProMED

Cryptosporidiosis in Australia

The following background data on Cryptosporidiosis in Australia are abstracted from Gideon www.GideonOnline.com and the Gideon e-book series. [1,2] :

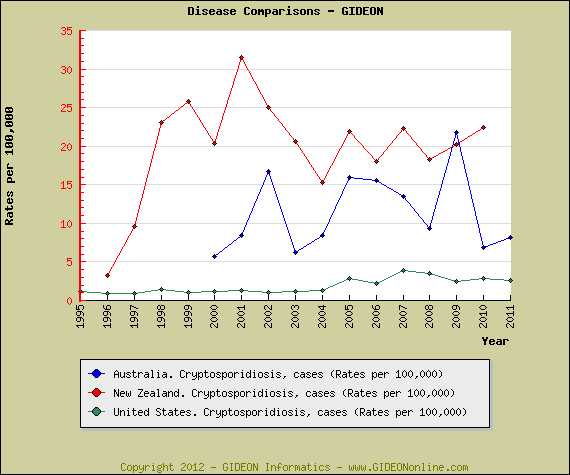
Rates of Cryptosporidiosis in Australia are somewhat higher than those in New Zealand, and 7- to 8-fold those reported in the United States. (see graph) [3]

Infecting species:
– Sporadic cases of cryptosporidiosis are caused by Cryptosporidium hominis, C. parvum, C. andersoni and C. fayeri
– Cryptosporidium parvum has been detected in the Sydney water supply since 1998.
– Cryptosporidium canis has been recovered from dogs, and C. felis from cats – neither posing a significant public health risk to humans.
– Cryptosporidium sp. have been recovered from urban-adapted Common brushtail possums (Trichosurus vulpecula) and barramundi (Lates calcarifer)
– Cryptosporidium cuniculus has been identified in rabbits.
– Cryptosporidium fayeri, a species associated with marsupials, has been identified in a case of human infection.

Prevalence surveys:
2.2% of HIV-positive MSM, 0.6% of HIV-negative MSM and 3% of controls (Sydney, 2003 to 2006)
0.8% of stool samples from symptomatic and asymptomatic subjects (Sydney, 2008 to 2009)
24.5% of pre-weaned sheep (Western Australia, 2009 publication)
22.3% of pre-weaned calves (Western Australia and New South Wales, 2010 publication)
58.5% of dairy and beef calves with diarrhea (Cryptosporidium spp., 2011 publication)
8.5% of fecal samples from animals living in Sydney water catchments (Cryptosporidium spp., 2011 publication)
71.4% to 81.3% of fecal samples from lambs in southern Western Australia (2011 publication)
9.3% of western grey kangaroos (Macropus fuliginosus) in Western Australia – 25% of these identified as Cryptosporidium fayeri (2011 publication)

Notable outbreaks:
1991 (publication year) – An outbreak of cryptosporidiosis was reported among children in Adelaide.
1994 to 1995 – Outbreaks (70 cases) were reported in the Sutherland area of Sydney during September 1994 to January 1995 – 17 of these acquired from a swimming pool.
1998 – An outbreak (161 cases confirmed) was reported in The Australian Capital Territory – 60% related to two public swimming pools.
1998 – Outbreaks related to swimming pools was reported in Brisbane, Sydney and Melbourne.
2001 – An outbreak (47 cases) in Tasmania was ascribed to animal contact at an agricultural show.
2002 (publication year) – An outbreak was associated with drinking unpasteurized milk.
2005 – Outbreaks (180 cases, approximate) were associated with swimming pools in New South Wales.
2008 – An outbreak in Sydney was associated with a swimming pool.
2009 – An outbreak (1,141 cases) was associated with swimming pools in New South Wales.
2009 – An outbreak (628 cases during January to March) was reported in Sydney.

References:
1. Berger SA. Infectious Diseases of Australia, 2012. 515 pp, 160 graphs, 2930 references, https://www.gideononline.com/ebooks/country/infectious-diseases-of-australia/
2. Berger SA. Cryptosporidiosis: Global Status, 2012. 77 pp, 47 graphs, 995 references. Gideon e-book series, https://www.gideononline.com/ebooks/disease/cryptosporidiosis-global-status/
3. See Gideon graph tool at https://www.gideononline.com/wp-content/uploads/Gideon-Graphs.pps

Featured on ProMED

Trypanosomiasis in Kenya

Rates of human Trypanosomiasis in Kenya are relatively low in contrast to surrounding countries – see graphs [1].
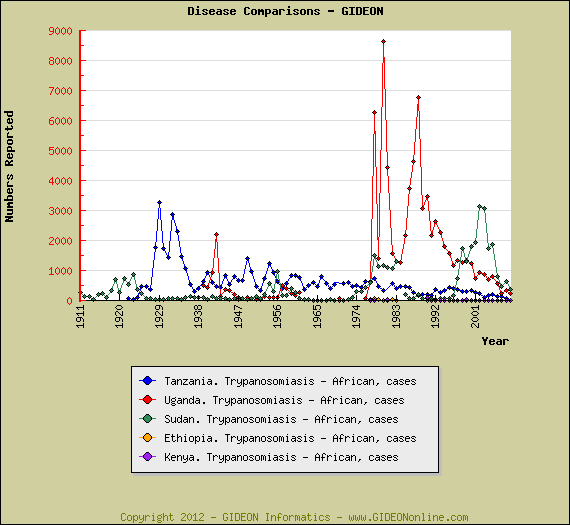
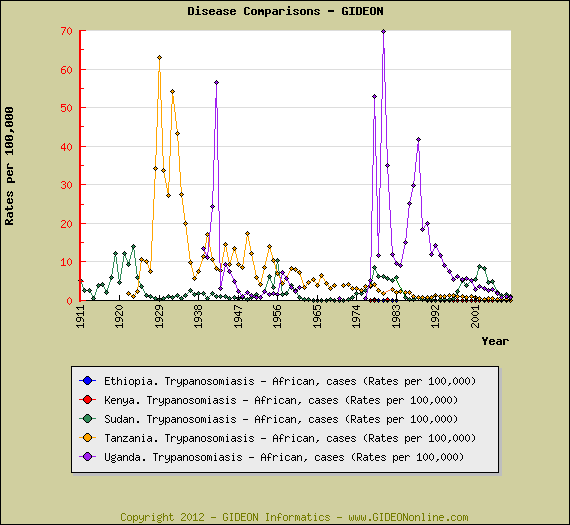
Although both disease incidence and rates per 100,000 are highest in Uganda and Sudan, most cases affecting tourists have been acquired in Tanzania.

The following background data on Trypanosomiasis in Kenya are abstracted from Gideon www.GideonOnline.com and the Gideon e-book series [2,3] (Primary references available on request)

Time and Place:
– African sleeping sickness first entered Kenya from Uganda in 1901.
– By 1965 Gambian sleeping sickness had virtually disappeared from Kenya, and was replaced by Rhodesian sleeping sickness.
– The disease is reported from the western region, and is relatively common in the Lambwe Valley, Nyanza region.
– As of 2004, endemic areas consisted of Bungoma, Busia and Teso districts (Ugandan border area).
– 912 cases of sleeping sickness were reported in the Lambwe Valley during 1959 to 1984

700,000 persons are considered at risk.

In one study, 100% of trypanosomiasis patients were found to be co-infected with malaria, 64.5% with helminthosis, 22.5% typhoid, 16.1% urinary tract infections, 12.9% HIV and 3.2% tuberculosis (2000 to 2009).

Exported cases:
1991 – An American national acquired trypanosomiasis following travel through Tanzania, Kenya and Rwanda.
1996 – A Mexican tourist acquired trypanosomiasis in Kenya.

The endemic species is Trypanosoma brucei rhodesiense.

The local vectors are Glossina pallidipes, G. swynnertoni and G. fuscipes ssp. fuscipes.

Trypanosoma brucei was detected in horses on a farm in Thika (1994 publication)

Prevalence surveys:
2.5% of domestic dogs in Busia and Teso Districts (2003 publication)
1% of livestock in Busia District (2011 publication)

Notable outbreaks:
1964 – An outbreak of African trypanosomiasis was reported in Alego, Central Nyanza, in 1964.
1980 to 1984 – An outbreak of African trypanosomiasis was reported in the Lambwe Valley.

References:
1. Gideon graph tool at https://www.gideononline.com/wp-content/uploads/Gideon-Graphs.pps
2. Berger SA. Infectious Diseases of Kenya, 2012. 404 pp, 61 graphs, 1741 references. Gideon e-books, https://www.gideononline.com/ebooks/country/infectious-diseases-of-kenya/
3. Berger SA. African Trypanosomiasis: Global Status, 2012. 53 pp, 37 graphs, 567 references. Gideon e-books, https://www.gideononline.com/ebooks/disease/african-trypanosomiasis-global-status/
Lyme Disease in the United Kingdom

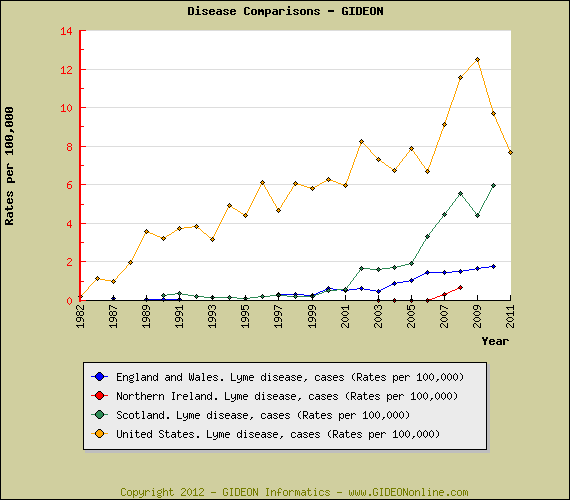
The incidence of Lyme disease has been increasing in the United Kingdom since reporting began, with highest rates in Scotland. In the following graph I’ve contrasted these rates with those of the Uhnited States. [1]

Reference:
1. Gideon graph tool at https://www.gideononline.com/wp-content/uploads/Gideon-Graphs.pps

Note featured on ProMED

Leprosy in India

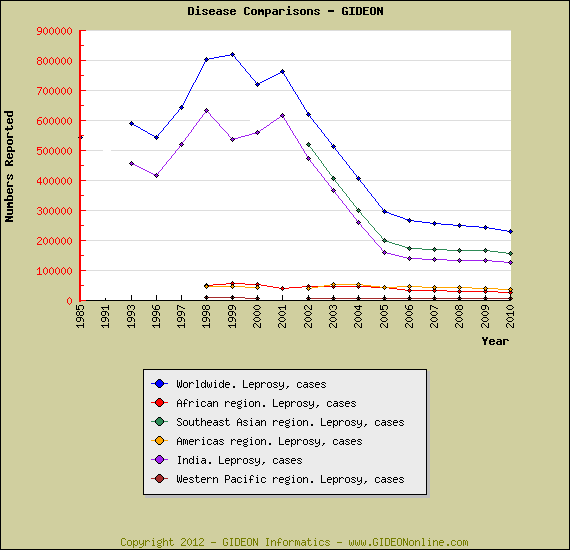
Southeast Asia continues to account for the most of the global leprosy burden, with more than 50% of the world’s cases reported from India. In the following graph, I’ve compared regional data with those of India. [1]

References:
1. Graph tutorial at: https://www.gideononline.com/wp-content/uploads/Gideon-Graphs.pps

Note featured on ProMED

H5N1 Influenza – Graphic Summary Through 2011

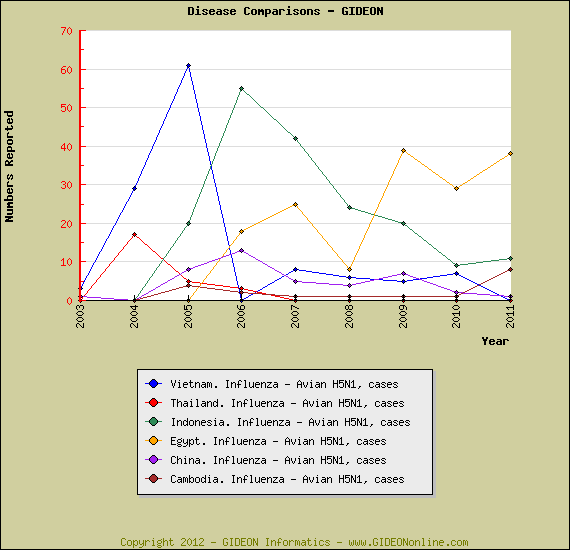
As of December 2011, most cases of human infection by H5N1 Influenza virus were reported in Cambodia, China, Egypt, Indonesia, Thailand and Vietnam. In the following graph [1], note that successive peaks were reported by Vietnam and Indonesia, followed by increasing activity in Egypt during recent years.

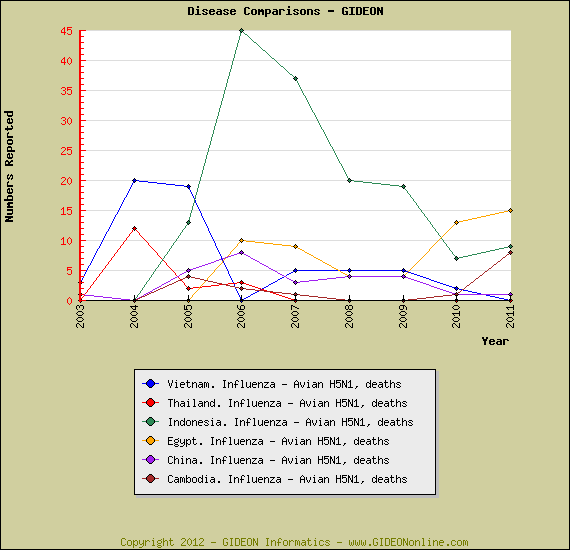
The second graph [1] illustrates the fact that a disproportionately high case fatality rate has been reported among cases occurring in Indonesia.

References:
1. Graph tutorial at: https://www.gideononline.com/wp-content/uploads/Gideon-Graphs.pps

Note featured on ProMED

GIDEON Sign In